Horizontal cross-section
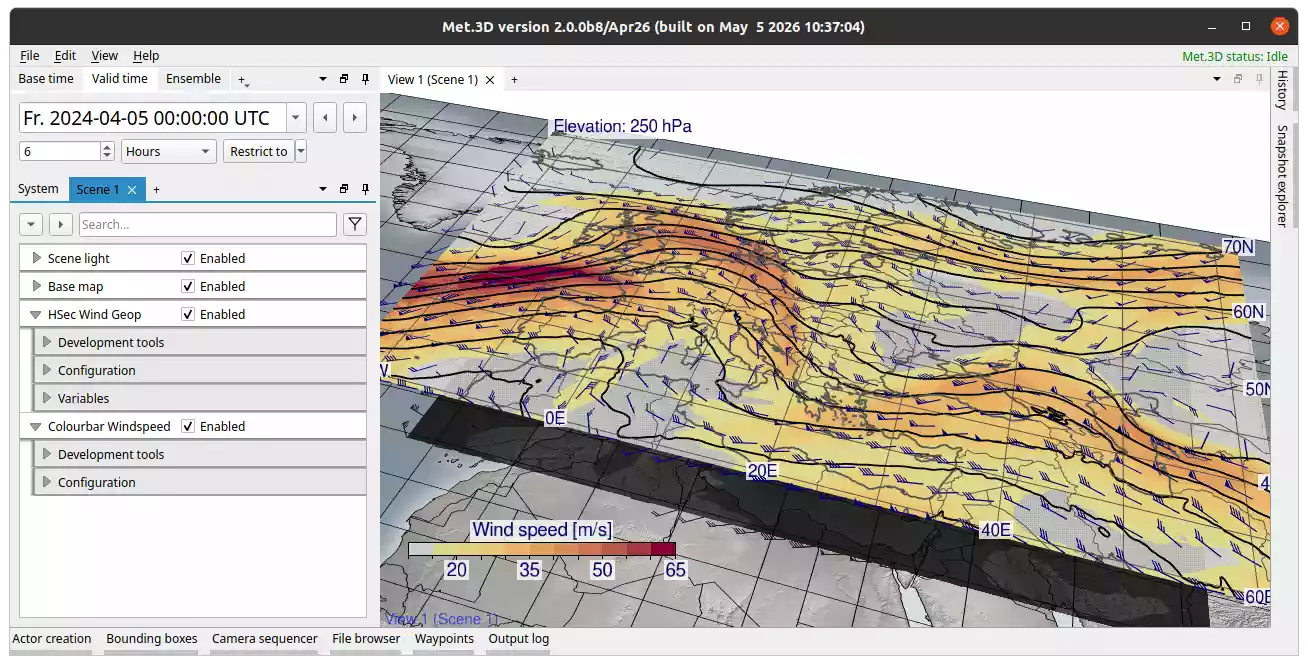
Fig. 23 Horizontal cross-section actor with transfer function applied. Base map added beneath.
Description
The horizontal cross-section actor renders a 2-D slice of atmospheric data at a specified pressure level.
Multiple data fields can be visualized simultaneously.
Each field can be rendered as line contours, filled contours, pseudo-colour plots, or textured stippling/hatching.
The section can be moved vertically by editing the elevation property or by dragging the corner handles, which are visible in actor interaction mode.
Graticule, coastlines, and country borders are integrated directly into the actor.
Multiple horizontal sections may be stacked within a single 3-D scene, and their elevation can be synchronized with each other.
Streamlines with attached wind barbs (streambarbs) and vector arrows are supported to visualize flow fields.
Elevation
The pressure level of the section is set via Horizontal section → Configuration → Elevation (in hPa). The corner handles visible in the scene can also be dragged vertically.
Elevation step size controls how far the section moves per drag increment.
To link the elevation of two horizontal section actors, use Synchronize elevation with and select the other actor. Both sections will then move together.
Rendering
Met.3D supports several rendering modes for each variable: filled contours, line contours, textured contours (stippling/hatching), and pseudo-colour. These can be combined.
Configure per-variable rendering under Horizontal section → Variables → your variable → Rendering. Options include contour spacing, thresholds, transfer function assignment, and smoothing.
Graticule, Coastlines, and Country Borders
Graticule lines, coastlines, and country borders are integrated components of the horizontal section actor, configured under Horizontal section → Configuration → Graticule, Coast lines, and Border lines respectively.
Their behaviour and options (enable/disable, colour, thickness, longitude/latitude range and spacing, custom shapefiles) follow the same pattern as described for the Basemap actor.
Vector Visualization
Met.3D offers two types of vector visualization in horizontal cross-sections:
Vector glyphs
Vectors are displayed as glyphs with adjustable size and scaling.
Several glyph types are supported, including different arrowhead styles.
Glyphs can be coloured by a scalar variable or vector magnitude.
Streambarbs
Streambarbs extend traditional streamlines by incorporating barb-style wind speed markers along the path.
Based on the Jobard and Lefer (1997) algorithm with enhancements, plus alternative seeding strategies such as uniform sampling.
Streambarbs are distributed to achieve even spatial coverage within the domain.
User-configurable spacing and loop detection options are provided.
Domain coverage check grid size: in domains with disjoint valid regions (e.g., over mountains at low pressure levels), a configurable grid detects unfilled areas and reinitializes the seeding algorithm there to ensure complete coverage.
Like glyphs, streambarbs can be colour-mapped using scalar fields or vector magnitude.
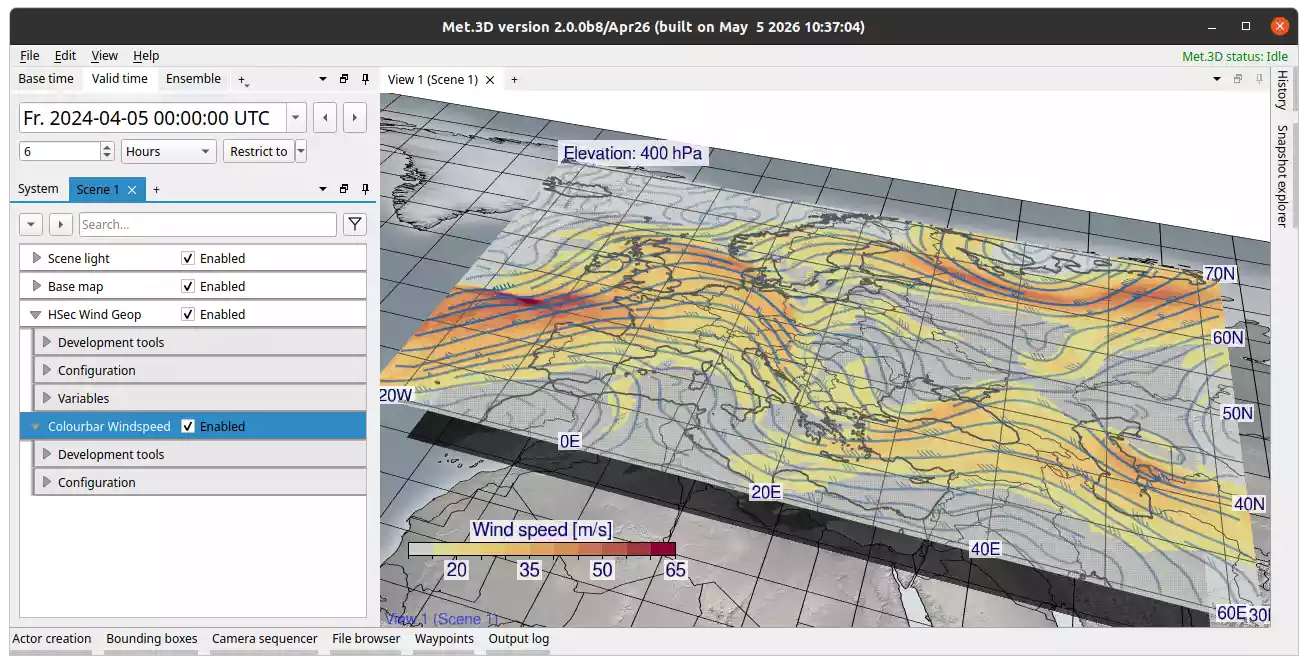
Fig. 24 Horizontal cross-section actor with shaded wind speed and streambarbs.
References
Jobard, B., and Lefer, W.: Creating evenly-spaced streamlines of arbitrary density, Proceedings of the Eurographics Workshop on Visualization in Scientific Computing, 45–55, 1997.