Introduction
Welcome to the documentation of Met.3D, the open-source visualization research software for interactive, three-dimensional visual analysis of gridded atmospheric data.
Before you start
The Getting started page is the best place to start if you are new to Met.3D. You will find Installation instructions and a tutorial for First steps with Met.3D.
Note
The documentation you are reading is work in progress. We are adding bits and pieces whenever we find time. If you don’t find the information you are looking for, please contact us. If you like to contribute to the documentation, please let us know as well!
About Met.3D
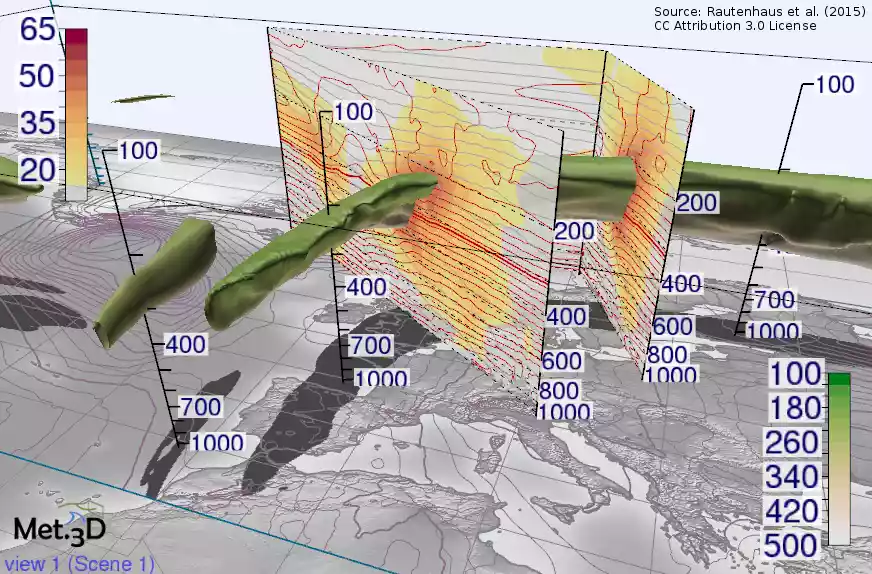
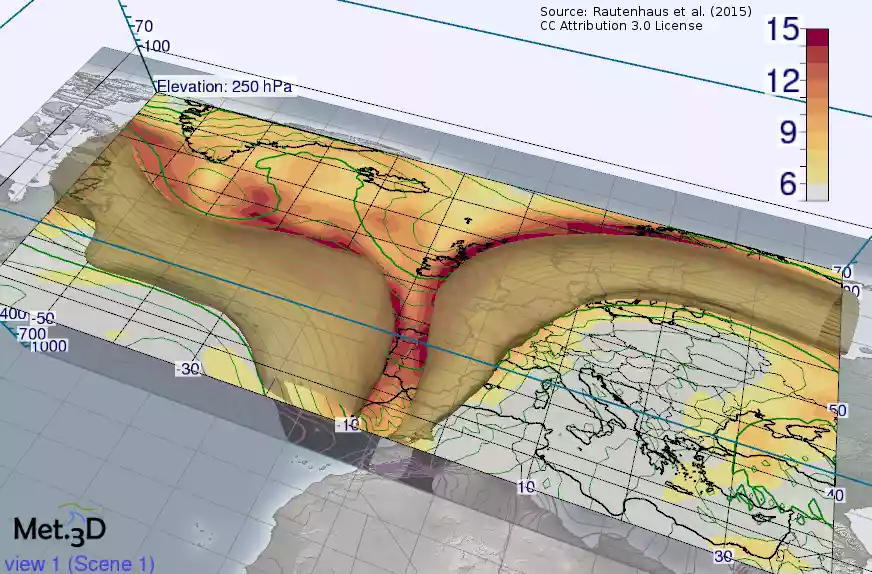
Met.3D is being developed as a research effort to improve visual analysis of 3-D meteorological data in research and forecasting. The software is implemented in C++ and OpenGL 4 and runs on standard commodity hardware. Its only “special” requirement is an OpenGL 4.3 capable graphics card. Met.3D currently runs under Linux. It has originally been designed for weather forecasting during atmospheric research field campaigns, however, is not restricted to this application anymore. Besides being used as a visualization tool, Met.3D is intended to serve as a framework to implement and evaluate new 3-D and ensemble visualization techniques for the atmospheric sciences.
Met.3D development is lead by the Visual Data Analysis Group at the Hub of Computing and Data Science of the University of Hamburg (UHH), Germany. Previously, development was also done within the Computing Graphics & Visualization Group of the Technical University of Munich (TUM), Germany. We much acknowledge funding we have received from the German Research Foundation (DFG), from 2015 until 2024 within the Collaborative Research Centre SFB/TRR 165 Waves to Weather (both at UHH and TUM), and ongoing within the UHH Cluster of Excellence CLICCS. Previously, development at TUM was also partly funded by the European Union under the ERC Advanced Grant 291372 SaferVis and the ERC Proof-of-Concept Grant “Vis4Weather”.
Met.3D research and development is led by Marc Rautenhaus, UHH (previously TUM).
Organization of the documentation
The documentation for Met.3D is organized into the following sections:
The Getting started section provides Installation instructions, and a tutorial for First steps with Met.3D.
Read the User Manual if you are a user (e.g., an atmospheric researcher, meteorology student, interested lay person). It provides information about supported data, user interface components, and visualization modules of Met.3D.
The Contributing section provides information on how to contribute to Met.3D. Please carefully read the information about the GIT workflow and about our coding conventions.
Finally, the Developer Manual contains information about the internal structure of Met.3D, including system modules, data pipeline, and actors. Conceptual descriptions of the architecture of selected features in Met.3D are provided in Architecture overview. Note that large parts of the Met.3D source code have been documented with the Doxygen code documentation system. A Doxygen configuration file is available in the Met.3D repository (in the
doc/doxygensubdirectory). Please run Doxygen locally to build the corresponding documentation.
In addition to this documentation, you may also want to take a look at the reference publication. Also, Marc’s PhD thesis contains additional details.
Rautenhaus, M., Kern, M., Schäfler, A., and Westermann, R.: Three-dimensional visualization of ensemble weather forecasts – Part 1: The visualization tool Met.3D (version 1.0), Geosci. Model Dev., 8, 2329-2353, doi:10.5194/gmd-8-2329-2015, 2015.
Rautenhaus, M.: Interactive 3D visualization of ensemble weather forecasts, Ph.D. thesis, Technical University of Munich, Munich, Germany, 195pp., 2015.
Credits
The Met.3D core development team currently consists of:
Marc Rautenhaus, UHH
Thorwin Vogt, UHH
Christoph Fischer, UHH
Maximilian Hartz, UHH student
We acknowledge the following individuals for their contribution:
Andreas Beckert, UHH (former core member - many thanks!)
Susanne Fuchs, UHH (former core member - many thanks!)
Kamesh Modali, UHH (former core member - many thanks!)
Justus Jakobi, UHH student
Alexander Klassen, UHH student
Jonas Lefert, UHH student
Marcel Meyer, UHH
Michael Kern, TUM (former core member - many thanks!)
Alexander Kumpf, TUM (former core member - many thanks!)
Bianca Tost, TUM (former core member - many thanks!)
Mathias Kanzler, TUM
Florian Ferstl, TUM
Fabian Schöttl, TUM student
Christoph Heidelmann, TUM student
Florian Hauer, TUM student
Max Bandle, TUM student
Jessica Blankenburg, TUM student
Raphael Kriegmair, LMU student
Philipp Kaiser, TUM student
Theresa Diefenbach, LMU student
Robert Redl, LMU
Alexander Thole, TUM student
We acknowledge support from ECMWF, in particular by Tim Hewson and Stephan Siemen and his group. Access to ECMWF data for our work has been kindly provided in the context of the ECMWF special project “Support Tool for HALO Missions”.