First steps with Met.3D
If you are a new user, this section guides you through first steps with Met.3D. For this tutorial, we use ERA-5 reanalysis data that can be downloaded from the Copernicus Data Store.
Download ERA-5 data
Before delving into Met.3D, spend a moment to download a set of ERA-5 data files. We provide instructions and a Python script for download in the Met.3D repository: https://gitlab.com/wxmetvis/met.3d/-/tree/master/templates/era5
Here, we use data from 22 Sept 2016 (a case during the NAWDEX field campaign), but feel free to download data of whatever case is of interest to you (simply adapt the corresponding dates in the Python script).
Start Met.3D
When starting Met.3D, you will see some info and debug output on the console. Fig. 1 shows the Met.3D window that appears on first start-up. It contains an empty visualization area, called a view.
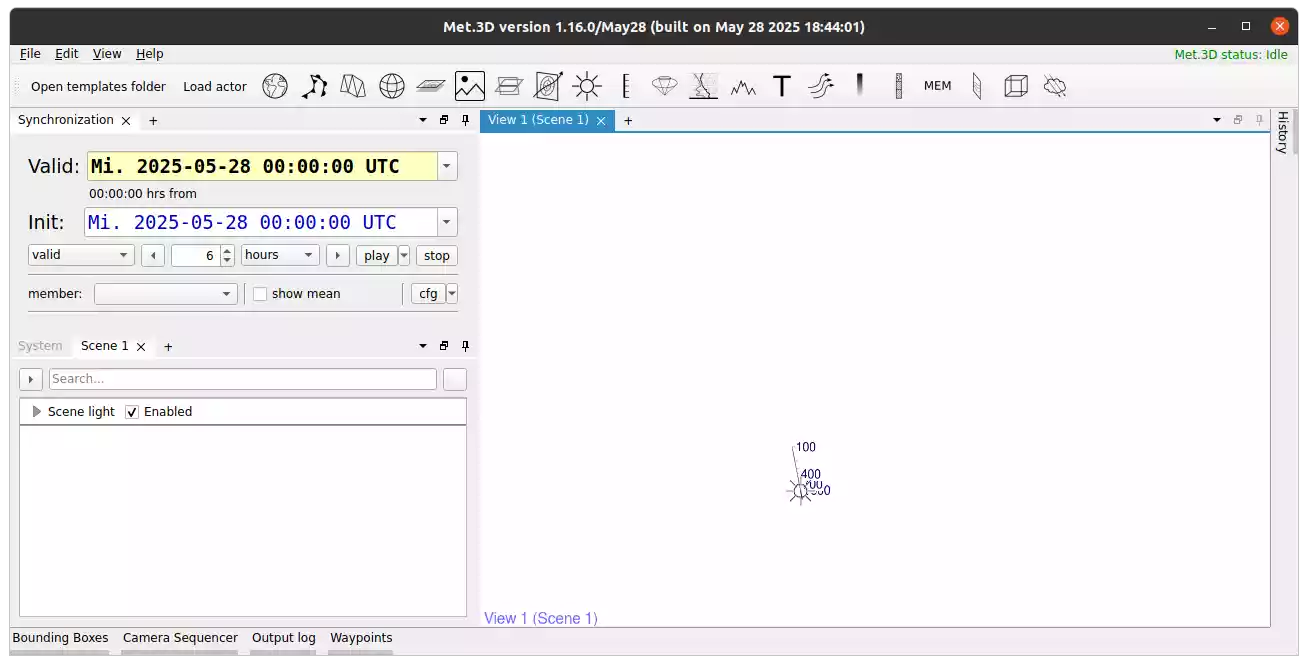
Fig. 1 The (empty) Met.3D main window that appears when first starting the software.
Load ERA-5 data into Met.3D
Press the Open templates folder button on the top left of the toolbar, and open the era5 folder. Copy the file era5.pipeline.conf.template file to a new file era5.pipeline.conf. Next, drag the new file into the empty Met.3D view. This will open the dataset dialog seen in Fig. 2. Please change the path of your dataset to the directory in which you have stored the ERA-5 data. Optionally, save the configuration with the button Save configuration to file at the bottom to store the modified path for future use. Afterwards, select Ok to load the dataset.
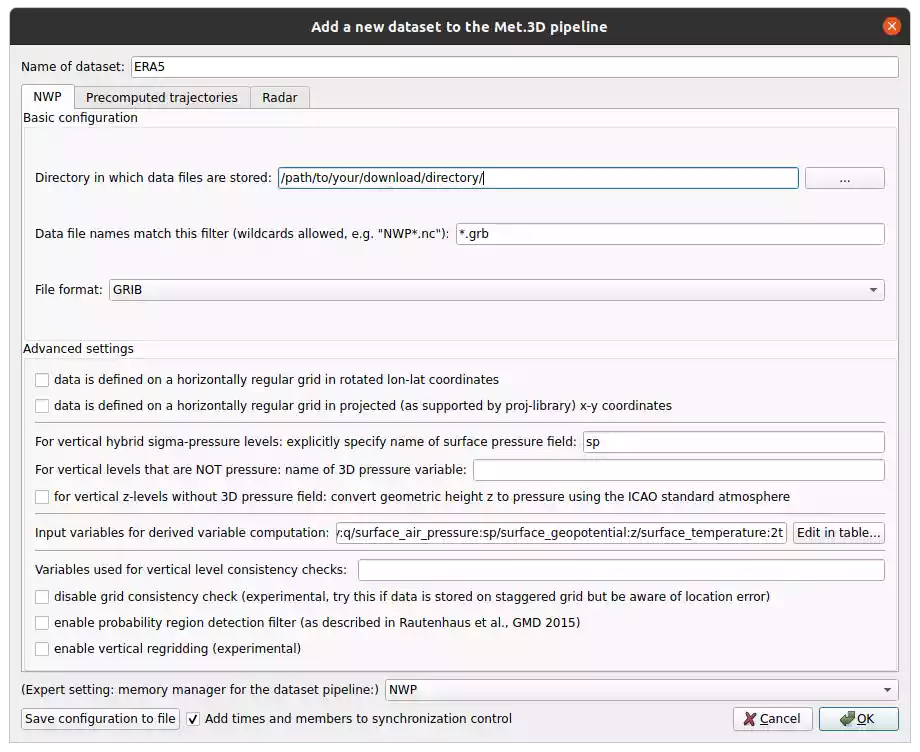
Fig. 2 The dataset dialog that appears when trying to load data into Met.3D.
Met.3D now displays a progress bar at the top right of the window showing the progress of loading the data. When you first load a set of GRIB files as downloaded from the Copernicus Data Store, Met.3D needs to scan all data. This may take a while. Loading the data subsequent times is much faster.
Using visualization templates
We provide predefined visualization modules for ERA-5 data (also for ICON-EU data). Again, open the template folder from the toolbar and navigate to the era5 folder. Open the folder vis_config, which contains pre-defined configuration files.
In Met.3D the individual visualization components are called actors. They represent for example, a base map, a 2-D horizontal or vertical cross-section, or 3-D isosurfaces. Details about the available actors are documented in Visualization modules (actors).
For a first visualization, open the base folder within vis_config. This folder contains basic visualization components, like a base map or colour maps. Drag the base map configuration (Basemap.actor.conf) file into the empty view in the Met.3D window. The actor is loaded and added to the scene currently viewed in the view. All actors in Met.3D become part of a scene. The panel of the left hand side of the Met.3D window shows which actors are currently part of a scene (Fig. 3).
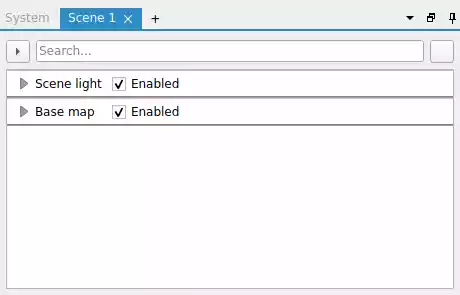
Fig. 3 The scene panel that lists the actors and their settings of a scene in Met.3D.
Your Met.3D windows should now look like Fig. 4.

Fig. 4 Met.3D with a single view with a basemap.
Experiment with adding further actors from the base folder into the scene, e.g., the volume bounding box.
Next, we add a horizontal map that displays some of the ERA-5 data. Navigate to the folder called hsec_vsec, which contains templates of horizontal maps and vertical cross-sections. Drag the configuration called HSec_Wind_Geop.actor.conf into the Met.3D view. This will create a horizontal map with wind speed mapped to colour geopotential height mapped to contour lines. Note that before the actor is created you will get a popup asking to load a required colour map (called transfer function in Met.3D) as shown in Fig. 5. Select Load transfer function, navigate to vis_config/colourbars, and select the visible configuration file.
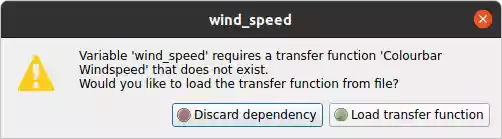
Fig. 5 The dialog window asking the user to load a transfer function that the horizontal section uses to display wind speed.
Now, Met.3D should look like Fig. 6.
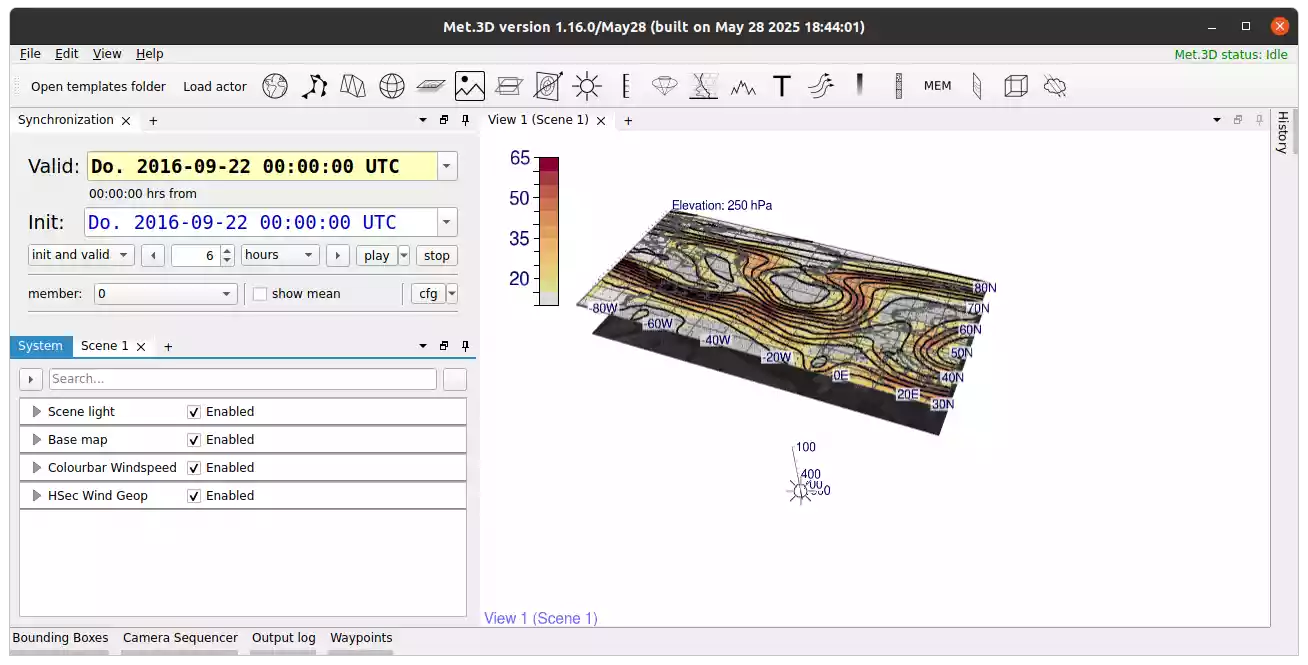
Fig. 6 Met.3D with a single view with a basemap and a horizontal cross-section displaying wind-speed at 250 hPa.
Experiment further by dragging other template actors into Met.3D.
Actor interaction
To interact with actors, double-click in a view to change to the actor interaction mode. The label at the bottom left of the scene now displays “actor interaction mode”. Now, the camera navigation is frozen and, in our example, the horizontal map shows little handle spheres at its corners. Drag one of the handles to move the map up and down (change its pressure elevation). Double click again to switch back into camera navigation mode.
Creating multiple views
In many applications more than one view is required, e.g., to view a scene from two different viewpoints. Additional views can be added by pressing the + button mext to the tab of the currently open view. You can drag the tab of the view and move it wherever you want (e.g., for side-by-side views).
For view options, right-click on a view for a context menu.
Creating multiple scenes
You can also create multiple scenes by pressing the + symbol next to the tab of the current scene in the left panel. Select the scene to be viewed in a given view by opening the view’s context menu.
Creating actors from scratch
The provided template actors serve as a starting point. To create your own actors, you can either modify a template (and save it as a new template configuration), or create a new actor from scratch. The toolbar at the top of the Met.3D window lists icons of actors available in Met.3D. Simply drag a symbol into a view. This creates an empty actor. Its settings can be customized in the scene panel on the right.