Actors
The visualization objects are called actors in Met.3D. They can be categorized into broadly three categories:
The subsections of this page provide a short description of the actors, as well as descriptions of how to modify common actor properties. Major characteristics of the actors are listed, however, many actors provide more properties than currently documented.
Actors providing scene context
These actors as such do not hold any gridded data, but they provide the infrastructure needed for building the scene context.
Actors that manage gridded data
These actors hold the gridded data and provide the various methods needed for visualizing the features.
Note
For all actors that visualize gridded data please note the following:
The “variables” of the actors can be synchronized with the global time and ensemble settings but don’t have to be synchronized (e.g. if different ensemble members shall be compared).
Availability of ensemble functionality depends on the data pipeline (if connected to an ensemble dataset, the pipeline can provide the data of different ensemble members or compute statistical quantities including ensemble mean and probabilities).
The following actors are currently able to visualize gridded data:
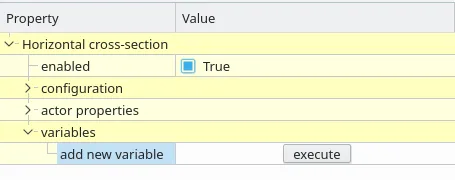
Adding variables
For all these actors, there exists an add new variable option. When clicking on execute, the list of variables available in the data loaded with the data pipeline is displayed and the user can choose the variable that needs to be added.
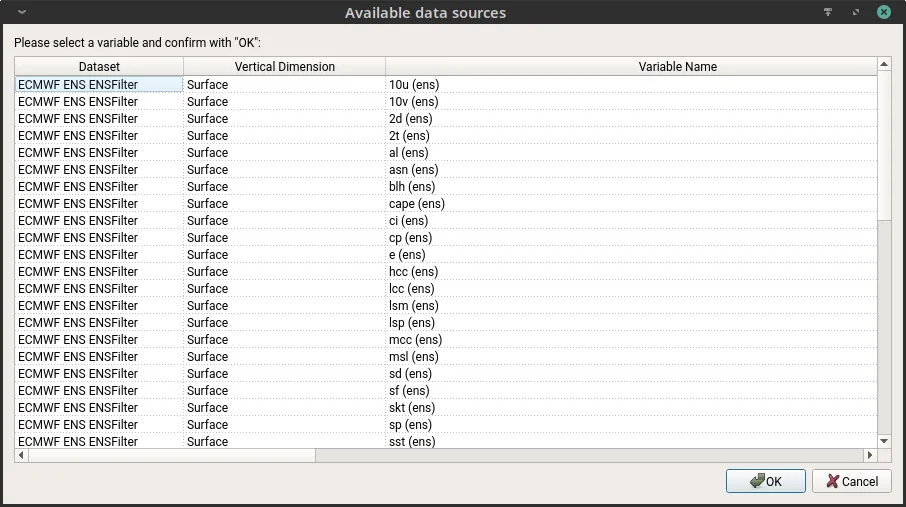
The user needs to repeat this step to add multiple variables or even the same variable multiple times. Also, once a variable has been added, it has options so that it can be removed or changed.
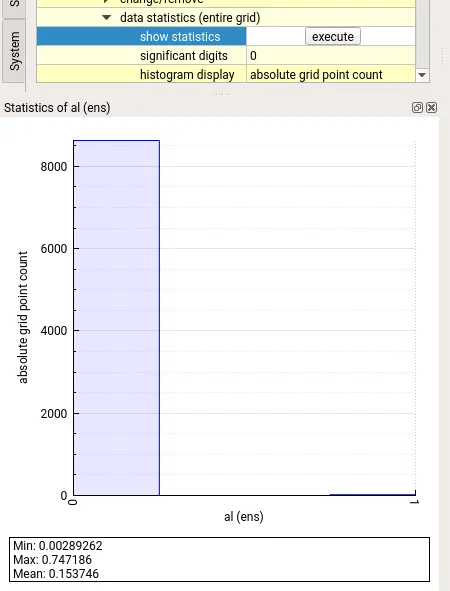
Getting information about a variables data
It is possible to get some statistics about the data of a given variable.
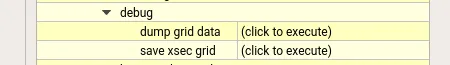
Also, it is possible to export the data to an external file for debugging purposes.
Smoothing the data
Met.3D provides options to smoothen the data.
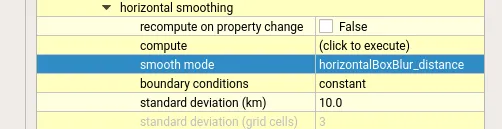
Currently, horizontal smoothing is possible using either distance based or grid cell based modes. We recommend using the smooth mode “horizontalBoxBlur_distance” with “symmetric” boundary conditions.
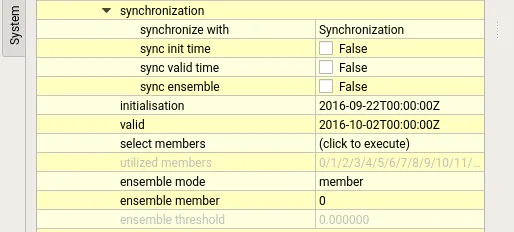
Visualizing ensemble data
Met.3D supports ensemble visualization. Each variable by default is synchronized to temporal extents and ensemble size based on the data loaded using the data pipeline. By, turning off the ensemble synchronization, the user can choose the members and the ensemble mode. Currently individual member or ensemble mean, standard deviation, min, max, max-min, above or below a threshold are supported.
Actors that manage trajectory data
Met.3D currently includes one actor that implements functionality to visualize trajectory data (i.e., Lagrangian particle trajectories / path lines, or streamlines).
The following actors are currently able to visualize trajectory data:
Prerequisite for using trajectory actors
A trajectory data set needs to be loaded, providing trajectories/stream lines that are either precomputed or computed on-the-fly. See Visualizing 3D trajectory data.
In short:
From the main “File” menu, select “New dataset”
Select the “Trajectories” tab
Precomputed trajectories:
Select the “Precomputed” tab and enter the directory path in which the trajectory files are stored. Data need to be stored in NetCDF files as described in Trajectory data in NetCDF format and can be distributed over multiple files.
Computation in Met.3D:
Select the “Computation in Met.3D” tab.
A gridded dataset providing u, v, w components of the wind field needs to be loaded before the trajectory computation is configured.
Select the gridded dataset on which the computation shall be based, then select the corresponding wind components.
To trace additional variables from the gridded dataset along the trajectories (to later colour the trajectories accordingly), enter the names of those variables in the field “Trace auxiliary variables…”